Fibonacci retracements are a staple tool among technical analysis enthusiasts in the currencies market. By tapping into the intrinsic mathematical relationships discovered by Leonardo Fibonacci, traders seek to forecast potential reversal zones, refine their entry and exit points, and enhance their overall risk management. This article delves into the core principles behind Fibonacci retracement, demonstrates practical application for major currency pairs, and offers insights on how to integrate these levels into a robust trading plan.
Understanding Fibonacci Retracements
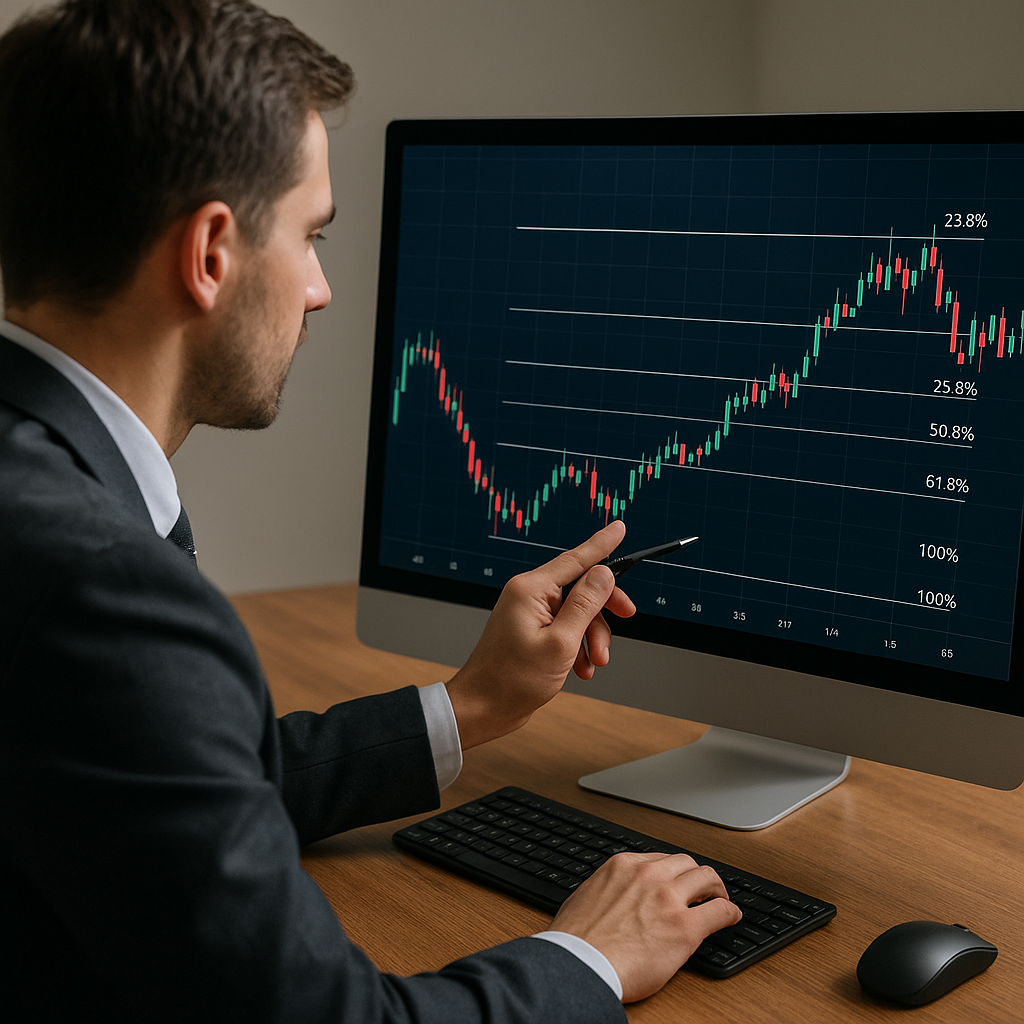
The concept of Fibonacci retracement stems from the famous Fibonacci sequence, in which each number equals the sum of the two preceding numbers. When translated to trading, key ratios derived from this sequence—23.6%, 38.2%, 50%, 61.8%, and 78.6%—represent potential areas where price may pause or reverse. These ratios are drawn between a significant high and low on a chart, forming horizontal lines that indicate support and resistance levels.
Origins of the Ratios
- The 61.8% level, known as the “golden ratio,” emerges from dividing one number in the sequence by its immediate successor.
- The 38.2% and 23.6% levels are derived similarly by dividing a number by the one two or three places to its right, respectively.
- The 50% level, while not a true Fibonacci ratio, is often included due to its psychological significance in markets.
Key Benefits
- Trend identification: Traders can confirm whether a pullback is likely to end near these levels and the primary trend to resume.
- Dynamic zones: Unlike static support and resistance, Fibonacci levels adjust with market swings, offering flexible perspectives.
- Confluence: Combining Fibonacci lines with other indicators (moving averages, trendlines) creates stronger trade signals.
Applying Fibonacci Levels to Identify Key Zones
Implementation begins with identifying a significant swing high and swing low on your chosen currency pair chart. In an uptrend, draw the Fibonacci retracement from the swing low up to the swing high; in a downtrend, reverse the process. The resulting overlay highlights potential retracement zones where market participants may react.
Step-by-Step Setup
- Select a reliable trading platform with built-in Fibonacci tools.
- Zoom out to view at least a few weeks of price history for clear swing points.
- Click on the swing extreme, drag to the opposite swing extreme, and release.
- Observe the horizontal lines at 23.6%, 38.2%, 50%, 61.8%, and 78.6%.
Trading Around Fibonacci Zones
When price retraces toward a Fibonacci line, watch for confirmation signals such as candlestick patterns (pin bars, engulfing bars), momentum divergence, or confluence from other technical tools. Common approaches include:
- Counter-trend entries near the 61.8% or 78.6% level in anticipation of a strong continuation.
- Break-and-retest strategies: Wait for a break below a retracement line, then enter on a retest.
- Scaling in positions around multiple levels for gradual exposure.
Integrating Fibonacci Retracements into a Trading Strategy
While Fibonacci retracement can stand alone, its effectiveness multiplies when used alongside other elements of a disciplined trading plan. Below are key components to consider:
Combining with Trendlines and Moving Averages
- Draw a trendline connecting recent highs or lows; a retracement that aligns with a Fibonacci level and the trendline strengthens confidence.
- Use a 50-period or 200-period moving average as dynamic support or resistance that converges with Fibonacci lines.
Money Management and Position Sizing
Successful traders never rely solely on a single indicator. Incorporate Fibonacci levels into a broader risk management framework:
- Define stop-loss orders slightly beyond the next Fibonacci level to avoid premature exits due to market noise.
- Set profit targets at subsequent retracement lines or swing extremes to lock in gains.
- Adjust position size so that a typical stop-loss risks only 1–2% of the trading account.
Example Trade
Suppose EUR/USD is in an uptrend from 1.1000 to 1.1500. You draw Fibonacci retracement, and price begins a pullback. It pauses near the 61.8% retracement at 1.1309. A bullish engulfing candle forms, confirming support. A trader can:
- Enter a long position at 1.1320.
- Place a stop-loss at 1.1280 (below the 78.6% level).
- Set take-profit targets at 1.1450 (38.2% retracement) and 1.1500 (swing high).
Common Pitfalls and Best Practices
Despite its popularity, Fibonacci retracement has limitations. Understanding common mistakes can enhance its reliability.
Avoiding Overfitting
- Do not apply Fibonacci to minor swings; focus on significant, well-defined retracements.
- Refrain from drawing lines repeatedly until you find perfect entry points—this introduces bias.
Ensuring Statistical Validity
- Test Fibonacci strategies over historical data across different currency pairs and market conditions.
- Combine backtesting with live demo trading to assess real-time efficacy.
Embracing Flexibility
- Recognize that price sometimes overshoots or undershoots exact Fibonacci lines; allow for small extensions.
- Treat these levels as zones rather than precise lines; look for price reaction in their vicinity.